Hello, everyone leading the future of mobility! This is Hermes Solution. Have you ever thought that cars these days are like “moving smartphones”? In the past, sturdy machines were the best, but now cars have become sophisticated systems that run on hundreds of millions of lines of software code. Especially with the increase in smart features such as ADAS and autonomous driving, the importance of invisible software has grown even more.
But here’s the crucial question: what if even a small error occurs in such a system? A simple navigation error might be cute, but errors in steering or braking systems could lead to truly terrifying accidents. That’s where the ISO 26262 international standard for automotive functional safety comes in.
This standard goes beyond being a technical guideline; it has become an essential requirement for survival in today’s automotive industry. It serves as a “common language” for OEMs and suppliers to trust and collaborate with each other within the global supply chain. Failing to comply with ISO 26262 could result in missed business opportunities, costly recalls, or damage to corporate image, making it a core risk management strategy beyond mere technology.
This post will serve as a comprehensive guide to mastering FMEA (Failure Mode and Effects Analysis) and FTA (Fault Tree Analysis), the core analysis techniques of ISO 26262. This knowledge is essential for anyone interested in safe automotive development!
The Heart of Automotive Safety: A Comprehensive Look at ISO 26262 and ASIL
To effectively apply ISO 26262, it is essential to first understand its core concepts. The standard follows the V-model development process, with the ASIL risk rating system at the center of all safety activities.
Safety Lifecycle (V-Model): The Beginning of Systematic Safety Design
ISO 26262 structures the development process like the letter V. The left wing represents the development stages from planning to design and implementation, while the right wing represents the verification and validation stages to ensure that all these stages function correctly. This ensures that safety requirements from the early stages of development are perfectly tracked and verified all the way to the final product.
Key Concept: Automotive Safety Integrity Level (ASIL) – A Measure of Risk
ASIL is at the core of ISO 26262’s risk-based approach. In simple terms, it is a rating system that determines “how safe it needs to be” based on the severity of potential risks.
Quick note: Don’t misunderstand! ASIL is not a rating for the component itself. While it is often referred to as an “ASIL D microcontroller,” this means that the component has the capability to be used in a system that requires ASIL D level. The actual ASIL rating depends on the risk caused when the component fails in a specific function.
Example: Even if it’s the same front camera, the safety requirements needed for rear parking assistance (low risk, ASIL B) and autonomous emergency braking (very high risk, ASIL D) are totally different, right? So, remember that ASIL is a “context-dependent” requirement for functions!
Three golden keys for determining ASIL
ASIL ratings are determined by comprehensively evaluating the following three factors:
Severity (S): How serious could the injury be if a hazard occurs? (S0: No injury ~ S3: Death/life-threatening)
Exposure (E): How often are you exposed to the hazard? (E0: Almost none ~ E4: Very high)
Controllability (C): How well can the driver control the situation when the risk occurs? (C0: Easy to control ~ C3: Difficult/impossible to control)
The combination of these three factors determines the final ASIL rating (A, B, C, D). ASIL D represents the highest risk and requires the most stringent safety measures. QM (Quality Management) is assigned when the risk is classified as unrelated to functional safety and follows general quality management.

<Table 1: ASIL Determination Matrix>
S0, E0, and C0 ratings are generally resolved by QM, so they are omitted from the table.
From bottom to top! Complete mastery of Failure Mode and Effects Analysis (FMEA)
Once the ISO 26262 safety objectives are set, the next question is, “How will failures occur and what impact will they have?” The powerful technique used here is FMEA!
FMEA: A “bottom-up” analysis that examines every corner of the system
FMEA is a systematic technique that starts with individual components (hardware, software) to thoroughly identify all possible failure modes and analyze the impact of these failures on the system and ultimately on the vehicle. It is a mandatory activity strongly recommended for all ASIL ratings!
How to perform FMEA!
Teamwork is important!: FMEA is a team activity involving design, manufacturing, and quality experts. It should not be performed formally after development is complete, but rather as a “living document” that is repeatedly performed from the early stages of design to prevent problems in advance.
FMEA Worksheet: Key Items
Item/Function: The component or function to be analyzed (e.g., front camera)
Potential Failure Mode: How could it fail? (e.g., “Image data stops”)
Potential Impact of Failure: What would happen if it failed? (e.g., “Causes lane departure”)
Severity (S): Severity of the final impact (1–10 points)
Potential Cause of Failure: Why might it fail? (e.g., “Software deadlock”)
Occurrence (O): Likelihood of the cause occurring (1–10 points)
Current Control Measures: Methods to prevent or detect failure (e.g., watchdog timer)
Detectability (D): The likelihood of detecting the failure (1–10 points; note that higher values indicate greater difficulty in detection!)
Prioritizing risks: Beyond RPN to Action Priority!
FMEA uses the formula RPN (Risk Priority Number) = S × O × D to quantify risk. The higher the RPN, the more urgent the need for improvement of the high-risk factor.
However, simply looking at the RPN number is not enough. Even if the RPN is low, failures with very high severity (S) must be managed as a top priority. Therefore, recent FMEA has introduced the concept of “Action Priority” to prioritize severity first. Remember that the true value of FMEA lies not in the RPN number, but in the process itself where the team discusses and analyzes high-risk events first!
FMEA Actual Case: Front Camera Module for LKA
Item: Front Camera Module for LKA System
Failure Mode: Camera continuously outputs frozen images
Impact: LKA system operates inaccurately, causing lane departure (Severity S=9)
Cause: Software deadlock in the camera’s internal processor (Occurrence O=3)
Detection Management Measures: Watchdog timer in the image processing ECU monitors frame updates (Detection D=2)
RPN: 9 × 3 × 2 = 54
(This value is used to determine the priority of improvement measures by comparing it with the RPNs of other failure modes.)

<Table 2: Example of a front camera module FMEA worksheet>
From top to bottom! Complete analysis of fault tree analysis (FTA)
While FMEA is a “bottom-up” approach that starts with small parts, FTA is a “top-down” analysis that looks at the entire system.
FTA: A ‘Deductive’ Analysis to Find the Root Cause of the Problem
FTA is a technique that starts with a specific system failure (‘top event’) and logically identifies all possible root causes (‘basic events’) that could lead to that failure. It is particularly essential for systems requiring high safety levels, such as ASIL C and D.
How to Create a Fault Tree!
Top Event: The starting point of the analysis! It must be a clearly defined system failure state, such as “unintended steering torque exceeding X Nm for more than Y ms.”
Logic Gates: Symbols showing the relationships between events.
AND Gate: All input events must occur simultaneously for the result to appear. (Complex failure modeling)
OR Gate: The result appears when any one of the input events occurs. (Individual cause modeling)
Intermediate and Basic Events: The process of breaking down the top event into multiple intermediate events, which are then broken down into basic events (component failure, software error, human error, etc.) that cannot be further decomposed.
Qualitative analysis vs. quantitative analysis
Qualitative analysis: Focuses on finding the most critical minimum cause combination (‘minimum cutset’) that triggers the upper-level event. If the cutset consists of a single basic event, it is a ‘single point of failure,’ which is a design flaw that must be eliminated in safety-critical systems!
Quantitative Analysis: Assigns failure probabilities (e.g., FIT) to each basic event to calculate the overall probability of the upper-level event occurring. This is used to demonstrate compliance with the PMHF (probabilistic metric for random hardware failures) target required for ASIL D systems.
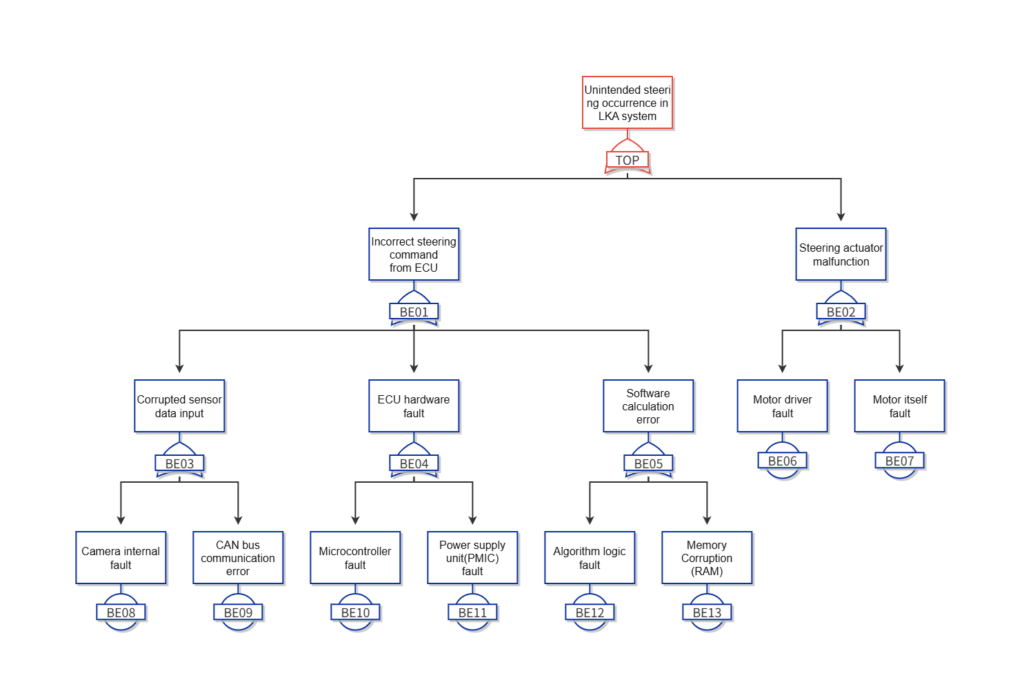
FTA Case Study: “Unintended Steering” in the LKA System
[Upper-level event] Unintended steering occurs in the LKA system
OR
[Intermediate event 1] Incorrect steering command from the ECU OR
[Intermediate event 2] Damaged sensor data input OR
[Basic event] Camera internal defect
[Basic event] CAN bus communication error
[Intermediate event 3] Software calculation error OR
[Basic event] Algorithm logic defect
[Basic Event] Memory corruption (RAM)
[Intermediate Event 4] ECU hardware defect OR
[Basic Event] Microcontroller defect
[Basic Event] Power supply (PMIC) defect
[Intermediate Event 5] Steering actuator malfunction OR
[Basic Event] Motor driver defect
[Basic Event] Motor defect
Integration of Analysis: Interaction between FMEA and FTA
FMEA and FTA are not simply individual analyses, but rather a pair that interact with each other to produce powerful synergy.
FMEA and FTA: Complementary Partners
These two techniques analyze problems from opposite directions and complement each other’s weaknesses.
Analysis Direction: FMEA is top-down (cause → effect), while FTA is bottom-up (effect → cause).
Analysis Scope: FMEA broadly explores “all” failure modes of a specific part, while FTA deeply analyzes “one” specific failure cause.
Strengths: FMEA excels at identifying component weaknesses, while FTA is strong at analyzing failure interactions in complex systems.
FMEA provides the list of potential failure causes that FTA requires, and FTA indicates how critical these causes are to the system. Through this feedback loop, the FMEA team can focus on preventing the most critical failure modes from a system-wide perspective.

<Table 4: Comparison of FMEA and FTA>
Conclusion: Safe cars are no longer a choice, but a necessity!
We have taken an in-depth look at FMEA and FTA. These two analysis techniques are not simple activities, but a process of building core evidence to prove automotive functional safety.
FMEA: Verifies that all parts are designed to be robust and that failure modes are well managed.
FTA: Verifies whether the system architecture has sufficient resilience even in the event of a critical failure.
All these analysis results are ultimately compiled into a “Safety Case,” which is used to logically prove how safe our vehicles are. This is a mandatory requirement for regulatory and certification agencies!
Beyond functional safety: SOTIF and cybersecurity!
The scope of automotive safety is expanding. Now, in addition to functional safety (ISO 26262), we must also consider SOTIF (ISO 21448), which addresses safety in unexpected situations (sensor limitations, external environments, etc.), and cybersecurity (ISO/SAE 21434), which protects systems from hacking attacks. Future automotive engineering is evolving in a direction that encompasses all three of these areas.
In conclusion, thoroughly understanding and utilizing systematic analysis techniques such as FMEA and FTA is no longer an “option” but a core competency for modern automotive engineers. The most important first step in creating safe and reliable future automobiles lies here!
I hope this article has helped you understand automotive safety architecture design. I look forward to sharing more useful information with you in the future! Thank you.